Problem
2007 AMC 8 Problem 2
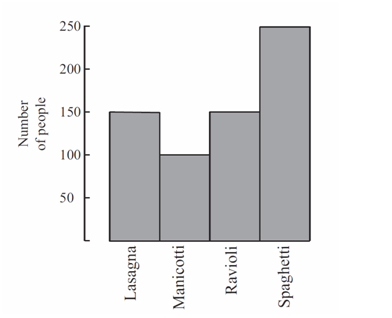
650 students were surveyed about their pasta preferences. The choices were lasagna, manicotti, ravioli and spaghetti. The results of the survey are displayed in the bar graph. What is the ratio of the number of students who preferred spaghetti to the number of students who preferred manicotti?
\textbf{(A)} \frac{2}{5} \qquad \textbf{(B)} \frac{1}{2} \qquad \textbf{(C)} \frac{5}{4} \qquad \textbf{(D)} \frac{5}{3} \qquad \textbf{(E)} \frac{5}{2}
Full credit goes to MAA for authoring these problems. These problems were taken on the AOPS website.
Want to contribute problems and receive full credit? Click here to add your problem!
Please report any issues to us in our Discord server
Go to previous contest problem (SHIFT + Left Arrow) Go to next contest problem (SHIFT + Right Arrow)
Problem feedback
Difficulty
—